Hot Summers, Hotter Cities: Measuring Heat Stress Where People Actually Are
Posted by Oscar Sjöberg on · 5 min read
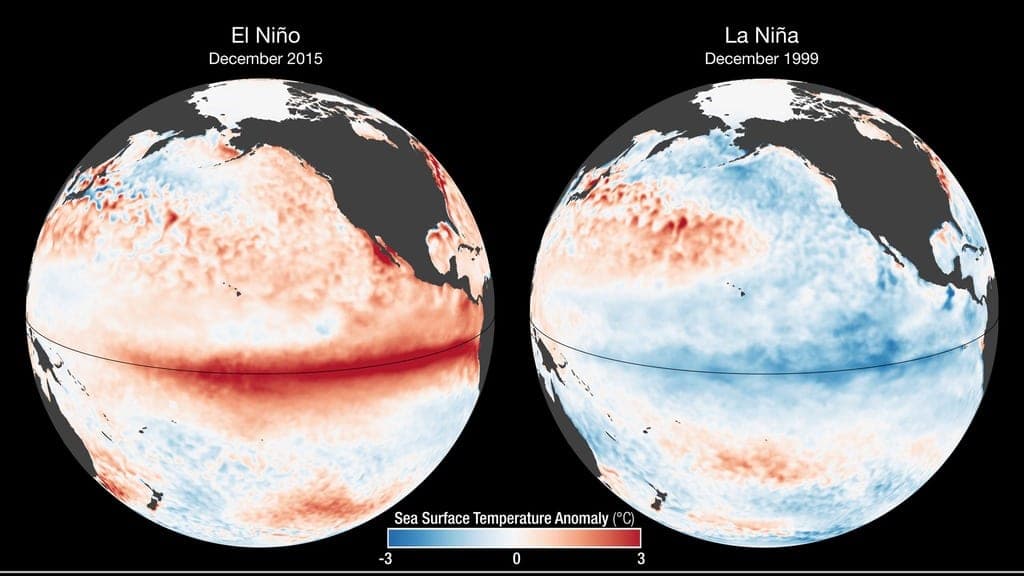
The major climate agencies are aligned on a cautious but clear message for the months ahead. The NOAA Climate Prediction Center puts the probability of El Niño developing in May–July 2026 at around 61%, with the event expected to persist into the end of the year. The WMO's April–June 2026 Global Seasonal Climate Update shows a widespread global signal for above-normal land surface temperatures, with particularly high model agreement across the Northern Hemisphere mid-latitudes (30°N–60°N) — the band that contains most of Europe's major cities and tourist destinations.
These are probabilities, not certainties. But the underlying trend they sit on top of is no longer in doubt. According to the WHO, heat-related mortality among people over 65 rose by roughly 85% between 2000–2004 and 2017–2021, and approximately 489,000 heat-related deaths occur each year worldwide, with 45% in Asia and 36% in Europe.
The problem is particularly sharp in cities — and it is not evenly distributed across them.
The Urban Heat Island Is a Local-Scale Phenomenon
Cities are warmer than their surroundings. Dense construction, paved surfaces, low vegetation cover, and waste heat from vehicles and buildings combine into the well-documented urban heat island (UHI) effect. The WHO notes that the health impact of heat is more pronounced in cities precisely because of this, and that poorer residents and those in low-quality housing are disproportionately exposed.
What is less often discussed is that the UHI is not uniform across a city. On the same hot afternoon:
·
Ready to Get Started with Environmental Monitoring?
Contact us today to discuss how Sensorbee can help you meet your monitoring requirements.
A shaded square with mature trees and a fountain can feel 5–8 °C cooler than a paved plaza two blocks away.
·A south-facing pedestrian street lined with stone buildings can retain heat well into the night.
·A transit interchange with glass canopies and little air movement can exceed the WBGT exposure limits used for occupational heat stress — while a park nearby remains comfortable.
A single airport weather station — which is how most cities still source their operational weather data — cannot resolve any of this. It gives a citywide average at a site that was deliberately chosen to be open, flat, and representative of the regional climate: the opposite of where most people actually spend a hot afternoon.
Who Is Exposed, and When
Three groups carry the greatest heat risk in a city, because they are the ones a public-health office is most likely to be asked about:
Older residents and people with chronic conditions. Heat-mortality data from the last two decades show this group carrying the largest share of excess deaths during heatwaves.
Outdoor workers. Street cleaners, delivery riders, construction crews, market vendors. Many are covered (in principle) by occupational heat-stress standards such as ISO 7243 and equivalent WBGT-based exposure limits.
Tourists. Often unfamiliar with local climate, walking long distances in direct sun, and under-hydrated. Travel-health research identifies heat-related illness as an increasing risk for travellers to hot-climate destinations.
What all three have in common is that their exposure depends on where in the city they are, not on the average.
What a City-Scale WBGT Network Looks Like
The same sensor stack that protects a construction site works at the scale of a neighbourhood. A compact pole can host everything needed for a full WBGT calculation:
WBGT input
Sensor
Standard
Air temperature & humidity
Sensorbee Air Pro 2 base station
CE
Air movement
Ultrasonic wind sensor (no moving parts)
—
Solar radiation
ISO 9060 Second Class pyranometer
ISO 9060, WMO
Mean radiant temperature
80 mm black globe thermometer
GB/T 17244, WBGT
Because each station is battery-backed and solar-powered with cellular (LTE-M / NB-IoT) uplink, it needs no trenched power or data cabling. That matters for a municipality: the locations that most need monitoring — historic squares, school courtyards, transit hubs, outdoor markets, riverfront promenades — are often the hardest places to install traditional infrastructure.
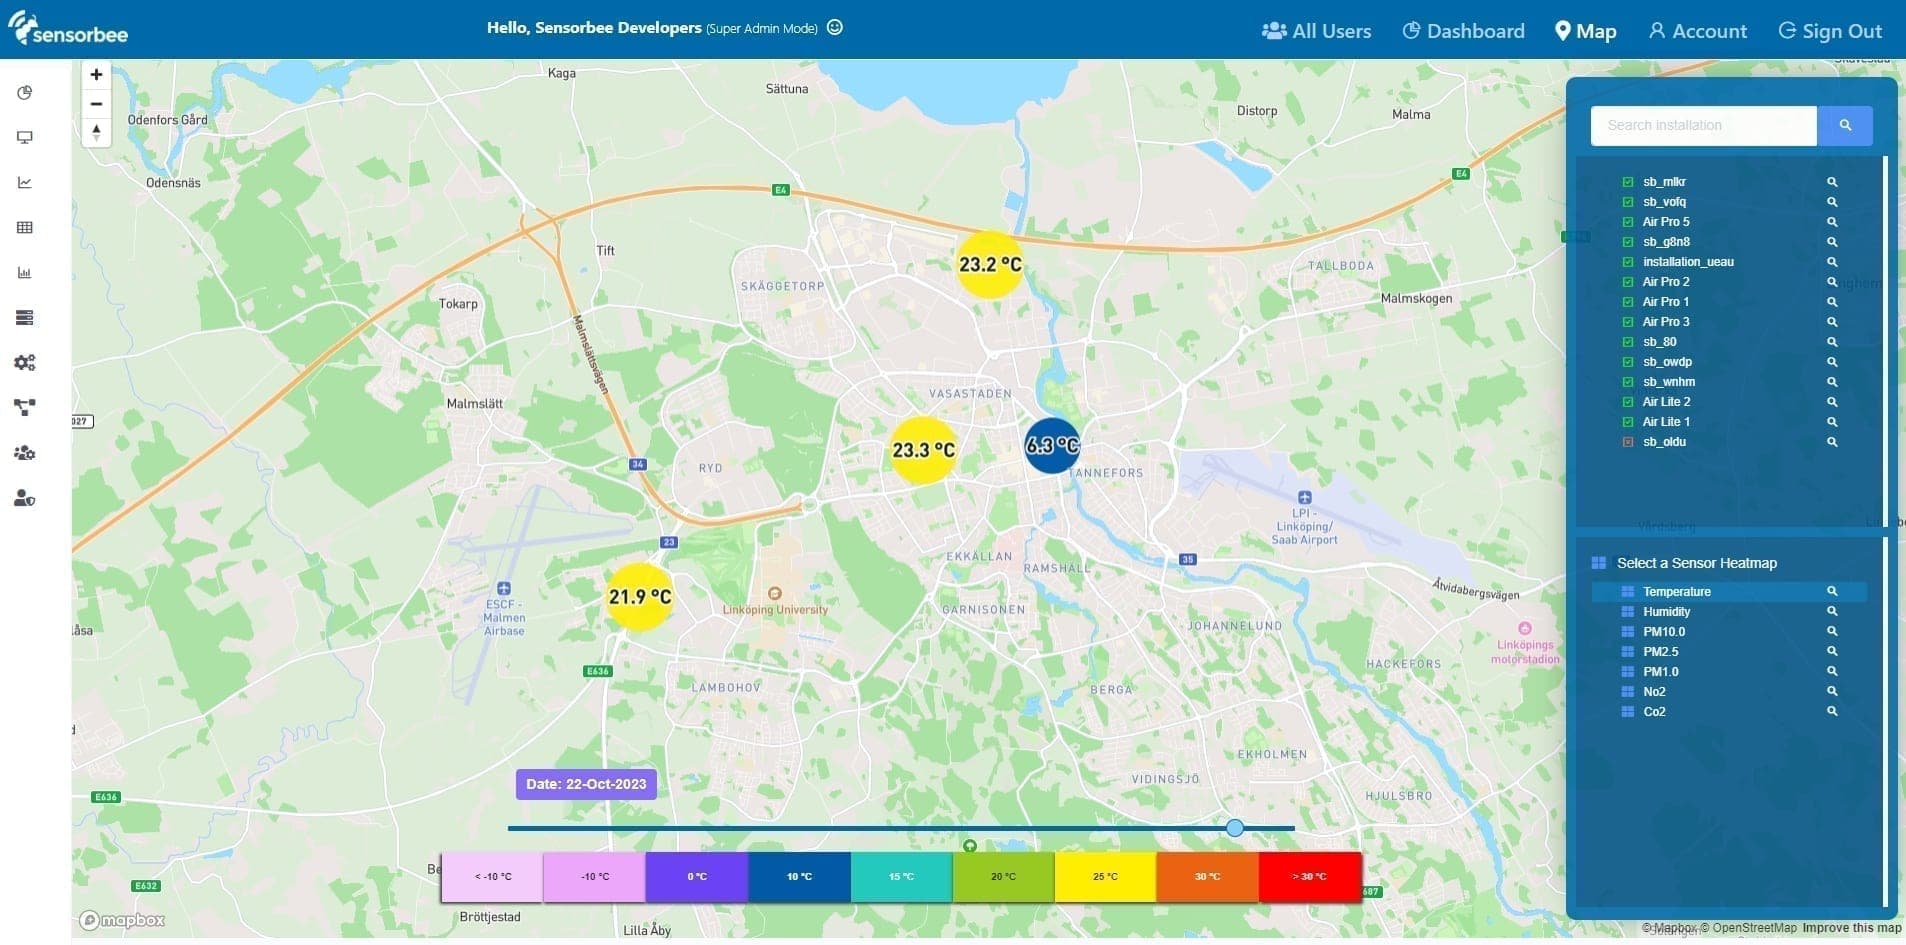
A ten- or twenty-station deployment turns a city from a single number into a live heat map: real WBGT, at head height, where people actually walk.
Heat Is Not the Only Thing Worth Measuring
The same base station that anchors a WBGT measurement also monitors particulate matter — PM1, PM2.5, and PM10 — and supports ground-level ozone (O₃) and other gas channels, alongside noise. That matters in a city context because the populations most vulnerable to heat are, in large part, the same populations most vulnerable to air pollution: older residents, people with cardiovascular or respiratory conditions, outdoor workers, and children.
Ozone deserves particular attention during an El Niño summer. It is not emitted directly — it forms in the atmosphere from precursor pollutants under strong sunlight, and it peaks on the same hot, sunlit, low-wind afternoons that push WBGT up. A network that measures WBGT and O₃ together captures the two heat-season health risks that most frequently coincide, at the same locations and on the same clock.
A single network of poles can report heat stress, particulate pollution, and ozone from the same locations, at the same cadence, to the same dashboard — rather than running three disconnected monitoring programmes. For a public-health office, that means one alert system, one dataset, and one place to point residents and tourists during a heat event.
What Cities Can Do with the Data
The point of measuring is to make better decisions. A live WBGT network supports the kinds of decisions cities are already taking, but on evidence rather than intuition:
·Public dashboards and real-time signage. Tourists and residents can see which areas are currently safe for sustained outdoor activity and which are not.
·Event-day decisions. Outdoor markets, concerts, and sporting events can adjust start times, shading, and water provision based on measured WBGT at the venue — not a forecast for the wider metro area.
·Targeted alerts to vulnerable populations. Public-health offices can route alerts to neighbourhoods where measured heat stress is actually highest, rather than issuing a blanket citywide warning.
·Urban-planning evidence. Multi-year data localises which streets, squares, and bus stops most need shade, greening, or reflective surfaces — and lets the city demonstrate, with numbers, that an intervention worked.
None of this is alarmist. It is the same principle cities already apply to air quality: measure locally, publish openly, intervene where the data says to.
A Conservative Close
We cannot prevent a hot summer, and no forecast — however high the model agreement — is a certainty. What we can do is give the people responsible for public health in a city the same quality of heat-stress data that a well-run construction site already has on a single pole: accurate, local, continuous, and tied to an internationally recognised standard.
If your municipality, event operator, or public-health team is thinking about how to prepare for the coming summer, get in touch — we would be glad to help design a network that fits.