

Posted by Oscar Sjöberg on · 7 min read
On 30 September 2026 the Copernicus Atmosphere Monitoring Service (CAMS) published its first Atmosphere Watch, a global review of how ground-level ozone, wildfire smoke and desert dust moved around the planet in the first eight months of the year. The headline figure travelled quickly: almost 40% of the world's population was exposed to extremely high ground-level ozone, and only 5% breathed ozone within the WHO guideline at all.
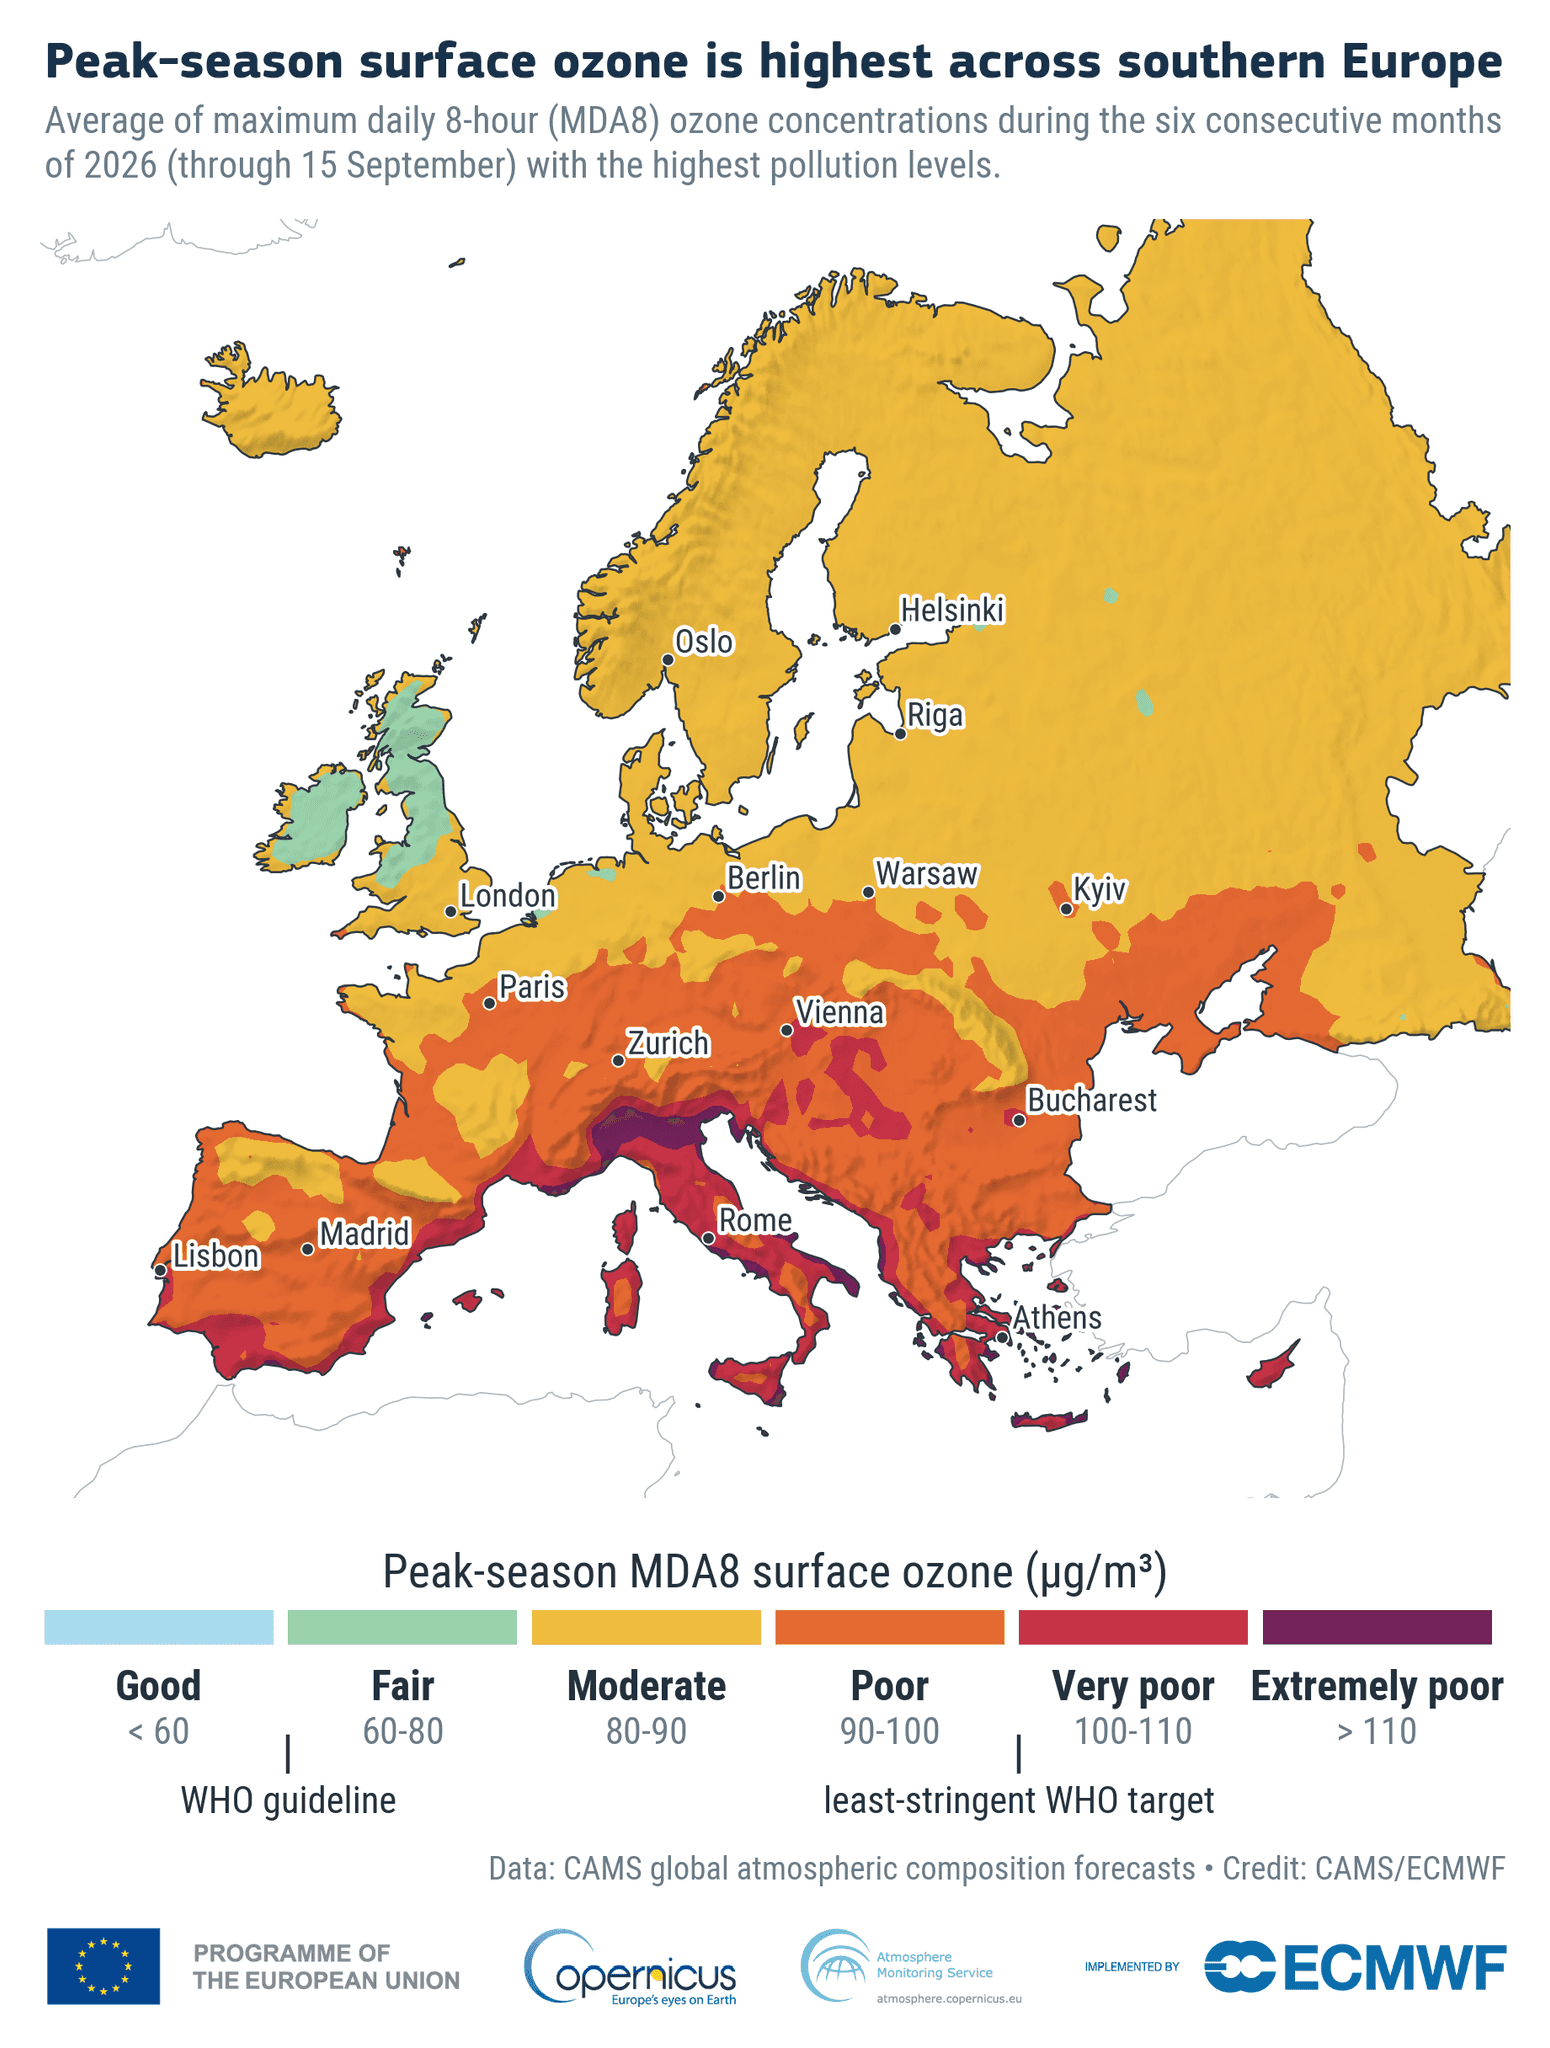
Europe did not escape. According to CAMS, half of Europe's population was exposed to ozone classed as Poor, Very Poor or Extremely Poor during the period, with the successive heatwaves of June, July and August pushing local ozone above the limit values set to protect health. The Scandinavian countries were not exempt, which is a change from the usual picture of ozone as a southern European problem.
This article summarises what the report found, why ozone and heat go together, what the exposure cost in health terms, and why the satellite and model data behind the report still depend on measurements taken at street level.
What the Copernicus Atmosphere Watch Found
CAMS, which is operated by the European Centre for Medium-Range Weather Forecasts (ECMWF) on behalf of the European Commission, combined population maps with its atmospheric models and ground and satellite observations to estimate exposure by region. The ozone picture for January to August 2026:
| Region | Ozone exposure, January to August 2026 |
|---|---|
| Asia | 60% of the population exposed to extremely high ozone, rising to 90% when Poor and Very Poor are included |
| North America | Over two-thirds exposed to Poor, Very Poor or Extremely Poor ozone, with Mexico City among the worst-affected cities |
| Europe | 50% exposed to Poor, Very Poor or Extremely Poor ozone, driven by summer heatwaves |
| Africa | 56% within Good or Fair; 8% exposed to Extremely Poor ozone |
| South America | 81% within Good or Fair |
| Oceania | 100% within Good or Fair, the cleanest region for ozone |
The second theme of the report is distance. Smoke from Canadian wildfires crossed the Atlantic and raised PM2.5 in Europe. Mega-fires in France, Spain and Belgium sent smoke thousands of kilometres from the burn. Saharan dust reached the Canary Islands and the Caribbean. As Florian Pappenberger, Director-General of ECMWF, put it in the press release, "Atmosphere Watch shows that air pollution knows no border."
Why Heatwaves Make Ozone Worse
Ground-level ozone is not emitted by any chimney or exhaust. It forms in the air when nitrogen oxides (NOx) from traffic, industry and combustion react with volatile organic compounds (VOCs) in strong sunlight. Three things happen in a heatwave that make this reaction run faster:
- ·More sunlight and higher temperatures speed up the photochemistry itself.
- ·Hot weather increases natural VOC emissions from vegetation, adding fuel to the reaction. Wildfires add more NOx and VOCs on top.
- ·Ozone stays elevated overnight, so each hot day starts from a higher baseline than the one before.
The result is a pollutant that peaks in the afternoon, on exactly the hot, still, sunlit days when people are outdoors, and that is often higher in rural and suburban areas than in city centres, because urban nitric oxide scavenges ozone locally while the precursors drift downwind and react there. The ozone monitoring guide explains the chemistry and the UK thresholds in more detail.
The UK saw this in late June 2026. Dr James Weber of the University of Reading reported that during the heatwave of 23 to 25 June, 60 of the 97 Defra sites measuring ozone exceeded the WHO guideline on the Tuesday, with 55 and 54 sites following on the Wednesday and Thursday, mostly in southern England. Across the EU, an analysis by Global Witness using CAMS modelling estimated that around 298 million people, roughly two-thirds of EU residents, were exposed to ozone above the 120 µg/m³ daily eight-hour mean between 21 and 28 June.
What Ozone Exposure Costs
Ozone irritates the airways, reduces lung function and aggravates asthma. Older people, children and anyone with a respiratory or cardiovascular condition are affected first. In its 2024 burden-of-disease briefing, the European Environment Agency attributed around 70,000 deaths in the EU-27 in 2022 to ozone exposure, alongside 239,000 for fine particulate matter and 48,000 for nitrogen dioxide.
The thresholds that matter in the UK and EU:
- ·WHO guideline (2021): 100 µg/m³ as a maximum daily eight-hour mean, with a peak-season average of 60 µg/m³.
- ·UK national air quality objective: 100 µg/m³ as a running eight-hour mean, not to be exceeded more than 10 times a year.
- ·UK and EU target value: 120 µg/m³ as a maximum daily eight-hour mean. The revised EU Ambient Air Quality Directive (2024/2881) tightens the allowed exceedances from 2030, as covered in our AAQD deadline article.
Laurence Rouil, Director of CAMS, described ozone as "a stark reminder of how interconnected our atmosphere, climate, health, and livelihoods really are." Ozone also damages crops and forests, which is why the report treats it as an economic as well as a health issue.
Why Satellites and Models Still Need Ground Sensors
Atmosphere Watch is built on CAMS's global and regional models, fed by satellite retrievals and the reference monitoring networks run by national agencies. That is the right tool for a continental overview. It is not the right tool for deciding whether to keep a school sports day indoors or where to site a cooling centre, for three reasons:
- Resolution. The CAMS regional ensemble for Europe works on a grid of roughly 10 km. Ozone varies on the scale of a park, a ring road or a suburb, as the rural-versus-urban pattern above shows.
- Latency. Exposure estimates of the kind in the report are compiled after the fact. A council managing a heat-health alert needs the reading from this afternoon.
- Sparse reference networks. The UK's Automatic Urban and Rural Network has fewer than 100 ozone sites for the whole country. Many towns have none, and most have no ozone measurement at the places where people spend hot afternoons.
The modellers know this. The reference networks and satellite feeds that CAMS assimilates are exactly what local sensor networks complement: dense, continuous, local measurement that fills in the grid.
Measuring Ozone Where People Are
The Sensorbee O3 sensor module is an electrochemical module certified to CEN/TS 17660-1:2022, with 1 ppb resolution, that plugs into the Air Pro 2 base station alongside particulate matter, NO2, NO and weather channels. Because ozone and nitrogen dioxide are chemically linked, co-locating the O3 and NO2 modules on one station shows whether a site is producing ozone or destroying it, and the same unit logs the air temperature and humidity that drive the photochemistry.
The Air Pro 2 runs on solar power with NB-IoT or LTE-M connectivity, so it can be fixed to a lamp post in a park, a school fence or a roadside pole without trenching for power or data. A network of ten or twenty units turns a 10 km model cell into a live ozone map of a town, reported to the same dashboard as PM2.5, NO2 and heat stress. For a public-health team, that means one alert system for the two risks that coincide on a hot afternoon.
Two points of honesty. Electrochemical ozone sensing is indicative monitoring, not the EN 14625 UV-photometry reference method, and a sensor network is a complement to the reference station, not a replacement for it. And the Air Pro 2's MCERTS certification covers PM2.5 and PM10 indicative monitoring, not the gas modules; what carries over to ozone is the same housing, power management, data chain and calibration discipline.
What Cities and Consultants Can Do Now
The 2026 ozone season is over, and CAMS has already flagged a strengthening El Niño for the year ahead. Three practical steps before next summer:
- ·Map the gaps. Compare the nearest reference ozone site with the places where vulnerable residents actually spend hot days: parks, school grounds, care homes, outdoor markets.
- ·Measure ozone and heat together. The same hot, still afternoons produce both. A station that reports O3, PM2.5 and WBGT heat stress gives one trigger for one public-health response, as described in our article on measuring heat stress where people actually are.
- ·Keep the data. A summer of local ozone readings is the evidence base for the next Air Quality Action Plan, and for showing residents that an intervention worked.
If your council, consultancy or public-health team wants to add ozone to a monitoring network before the 2027 season, get in touch or download the product catalogue to see the full Air Pro 2 sensor range.
Sources: Copernicus Atmosphere Monitoring Service, Atmosphere Watch, 30 September 2026; European Environment Agency, Harm to human health from air pollution in Europe: burden of disease 2024; University of Reading expert comment, 26 June 2026; Global Witness analysis of the June 2026 heatwave, July 2026.

Oscar Sjöberg
Partner & Embedded Software Engineering Manager